The Australian 200 Index Futures (ASX: S&P/ASX 200) closed a second consecutive session of gains on Wednesday as the bets of a China government stimulus, and the positive economic indicators from the Australian economy continued to boost the index ahead of the crucial US inflation data due later today.
The recently released NAB Business Confidence Index and Westpac Consumer Confidence Index data showed that the market is optimistic towards the Australian economy, boosting the index higher. The NAB Business Confidence Index increased from -4 to 0 in June, while the Westpac Consumer Confidence Index increased by 2.7% to 81.3. Easing inflationary jitters supported a jump in consumer confidence, while consumers remained cautious about interest rates.
Technical
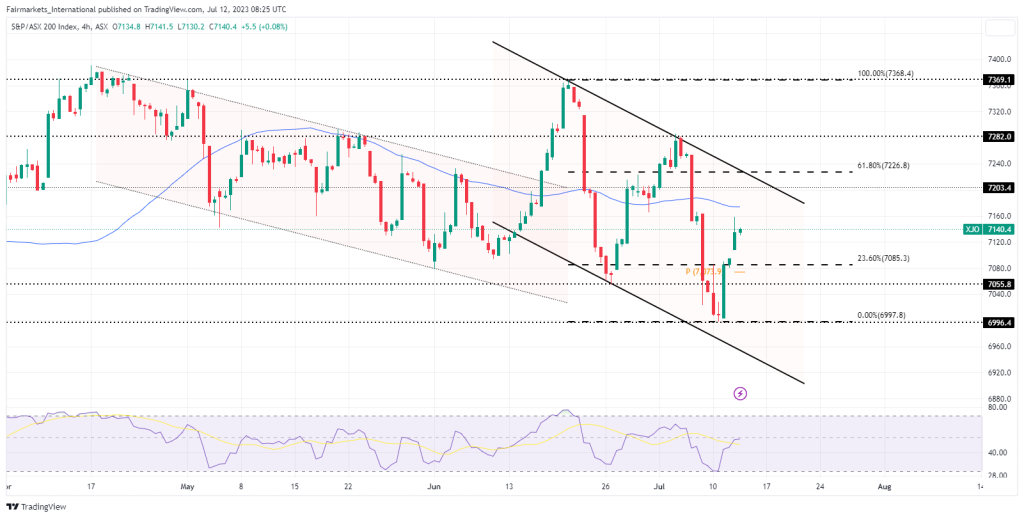
The 4H chart shows that index futures have been in a descending channel trading pattern for the past few months. This means that the bears have been in control of the market, and the price has been trending lower. However, the chart also shows that the index futures are currently enjoying some short-term bullish momentum. This momentum could be tested by the 50-SMA (blue line), which is a key moving average that could act as resistance.
If the recent bull momentum persists and the index futures break above the descending channel and the golden ratio, the next resistance level to watch is 7282.0. This is a key level, and a break above this level would suggest that the bulls are back in control. The bulls could then target the next resistance level at 7369.1.
However, if the index futures fail to break above the descending channel, the potential for a major pullback is in play. The 7055.8 level is likely to act as a level of support, and if the bears are able to break below this level, they could target the support at 6997.8, which is a four-month low.

Summary
The index futures closed the second consecutive session with the bulls on top ahead of the US inflation data due later on Wednesday. Therefore, cooler inflation data could help the bulls extend their current dominance, with a hot reading likely to resume the longer-term bearish trend.
Nevertheless, the bears could be confident in keeping the longer-term bearish trend intact should the 61.80% Fibonacci retracement level remain in play.
Sources: TradingView, Reuters, MT Newswire.
DISCLAIMER: This report has been prepared by Fairmarkets International (“The Company”). This document is not intended as an offer, solicitation or recommendation to buy or sell financial instruments or to make any investment. The Company has used reasonable efforts to obtain information from reliable sources and the report is provided without representation or warranty of any kind (neither expressed nor implied). The Company and Fairmarkets International disclaims liability for any publication not being complete, accurate, suitable and relevant for the recipient. Specifically, the Company and Fairmarkets International disclaims liability towards any user and other recipients of this report.


