

The GBPJPY currency pair, also known as the Dragon, could continue to see wild swings after the latest round of economic data across both regions.
The Bank of England (BoE) raised interest rates by another 25 basis points last week and saw little optimism return to the British Pound (GBP) as the reality of a recession is sinking in. Rates have been pushed to a 15-year high, and the UK central bank has left the door open for more rate hikes in September and beyond to try and combat inflation.
UK bond sales were also discussed in the monetary policy sitting. Still, no other Bond news was as topical as the changing Japanese monetary policy effects on the Yen carry trade. The carry trade, one of the year’s most popular trading strategies, could be upended as the Yen becomes more expensive. The Yen has been the base currency of choice for carry trades this year as it has lost over 10% in value against the Pound (GBP) over the last twelve months, but changing policy stance from the Bank of Japan (BoJ) could uproot all of that if the Yen gains strength.
Technical
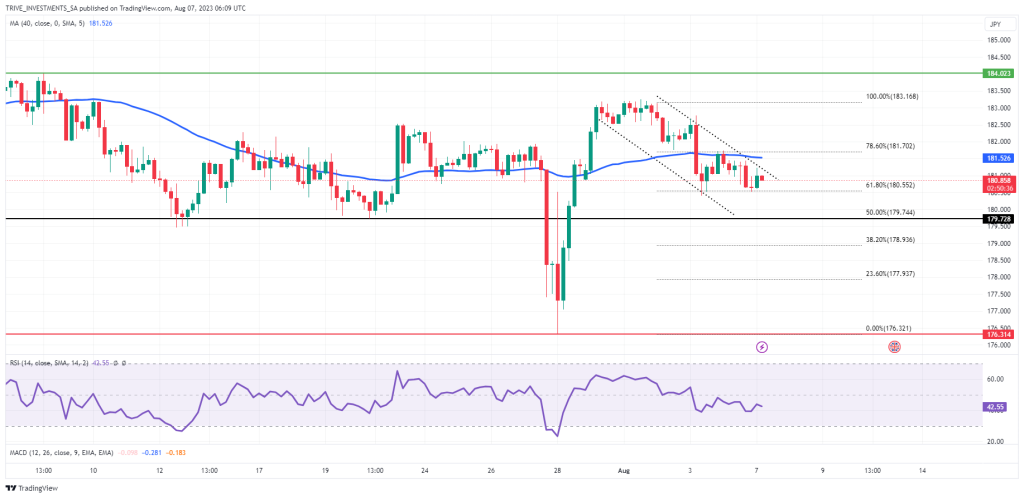
The 4H chart of the GBPYPY currency pair shows that the price action is moving lower in a descending channel. The currency pair’s price action is finding support at the 180.552 level, which coincides with the 61.80% Fibonacci golden ratio. If the price continues lower, we need to see the currency pair break down below this significant Fibonacci support level and continue lower within the channel toward the 179.728 support (solid black line).
If the British Pound sees some strength this week, we need the currency pair to trend higher above the 50-day SMA (blue line) and break out of the descending channel. Higher overhead resistance levels could be 181.702 and 183.168, which traders should note.
Summary
This week’s focus remains on economic data and the US Inflation data, which could see volatility return to a basket of currencies connected to the US Dollar (USD). On the downside, major levels to watch on the GBPJPY currency pair would be the 61.80% Fib retracement level and the significant support level at 179.744. Traders should note overhead resistance levels around the 78.60% Fib retracement and the 183.168 price level.
Sources: Bloomberg, Reuters, TradingView
Piece Written By Barry Dumas, Head of Client Education.
DISCLAIMER: This report has been prepared by Fairmarkets International (“The Company”). This document is not intended as an offer, solicitation or recommendation to buy or sell financial instruments or to make any investment. The Company has used reasonable efforts to obtain information from reliable sources and the report is provided without representation or warranty of any kind (neither expressed nor implied). The Company and Fairmarkets International disclaims liability for any publication not being complete, accurate, suitable and relevant for the recipient. Specifically, the Company and Fairmarkets International disclaims liability towards any user and other recipients of this report.