

The announcement of a trade agreement between the US and Japan has ensured that Japanese stocks continue enjoying a wonderful week. The agreement of bilateral free trade of lithium, a vital ingredient in the production of electric vehicle batteries, pushed most of the sectors trading higher a day after the announcement, with Nikkei 225 Index Futures (CME: NIY) trading at 1.33% higher on the day and 1.51% higher for the week.
The futures index had also enjoyed an excellent start to the week as the easing of fears sent investors towards the riskier assets. Gains in the pharmaceutical, rubber and railway and bus sectors primarily drove the futures gains on the Wednesday trading session. The largest contributors included SoftBank Group, J.Front Retailing Co. Ltd and Isetan Mitsukoshi Holdings, which rose by 6.18%, 3.79% and 3.34%, respectively, during the trading session.
Technical
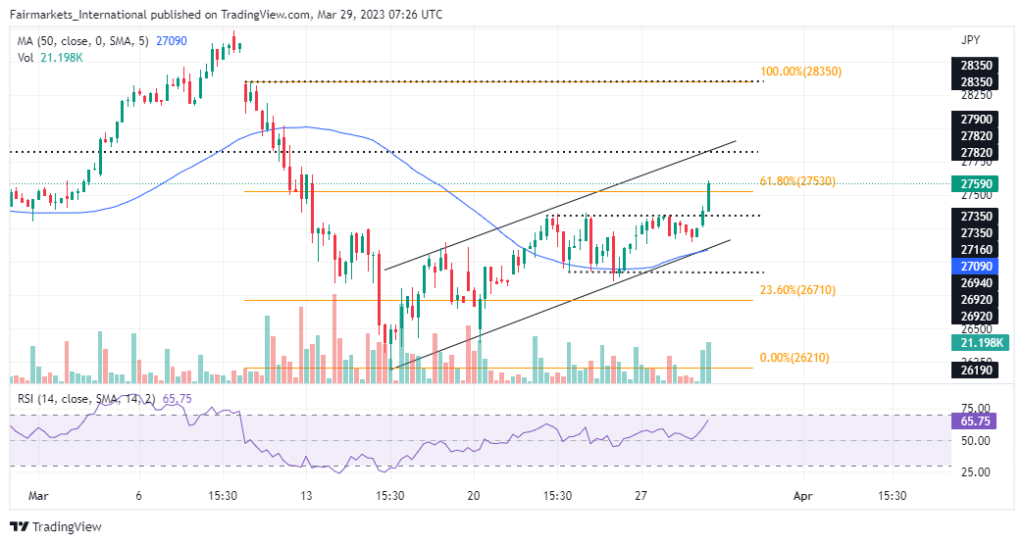
The 4H chart shows that the index futures are currently trading within an ascending channel pattern as the bulls look to reclaim ground recently lost to the bears. The bulls could be confident in the short-term continuation of the rally, with the futures currently trading above the 50-day moving average. Still, they could find it difficult to sustainably break through the golden ratio at the 61.80% Fibonacci level.
For a bullish sentiment, a golden ratio breakthrough could confirm the rally’s extension. The bulls could look to test the resistance level on the 5th of February 2023 high of 27820, the initial level of interest, if the breakthrough is sustained. Increased buying momentum could be needed if the bulls look to test the next resistance level at 28350.
The failure to move substantially through the golden ratio could signal the presence of sellers. Suppose there is a pullback of the current price action, the bears could be confident in testing the initial level of interest at the support level of 27350. The 27350 price level breakthrough could bring the 50-day moving average and the channel’s lower trendline into play as the bears target the next support level at 26920.
Summary
With the price action having tested and rejected the channel’s lower trendline, the bulls might be confident in the rally and could look to retest the channel’s upper trendline. Thus, a trading opportunity could exist as the price action breaks through the 27820 price level but could fall short of the 28350 resistance level in the short term.
Sources: TradingView, CNBC, Investing.com.
DISCLAIMER: This report has been prepared by our Group company. This document is not intended as an offer, solicitation or recommendation to buy or sell financial instruments or to make any investment. The Group has used reasonable efforts to obtain information from reliable sources and the report is provided without representation or warranty of any kind (neither expressed nor implied). The Group disclaims liability for any publication not being complete, accurate, suitable and relevant for the recipient. Specifically, the Group disclaims liability towards any user and other recipients of this report.