

The AT&T Inc. (NYSE: T) share recovered some of the losses experienced after the impulsive selloff following the telecommunication company’s mixed first quarter of 2023 (2023Q1) earnings report. The company reported a top-line miss for the quarter after reporting quarterly revenue of $30.139 billion, 0.36% lower than the market’s forecast of $30.248 billion. However, the company’s bottom line came in above expectation at $0.60/share versus the forecasted $0.585/share.
The share is recovering from a company’s share worst decline in 23 years. The share plunged to a 10.41% decline following the after-the-bell reports, which showed that the company’s free cash flow declined to around $1 billion for 2023Q1, which was lower than the expected amount to cover the $2 billion quarterly payout for dividends.
Technical
The daily chart shows that the price action of the communication services giant share found buyers at around $17.50/share following the massive selloff following the quarterly earnings release. The presence of buyers and the appearance of the golden cross as the short-term 50-EMA moved above the longer-term 200-EMA could suggest that the market is overall bullish towards the share.
Therefore, should the bulls continue to push the share price higher, the 200-EMA could act as the immediate resistance level to the bulls’ run. A move above the 200-EMA would bring the initial level of interest at the $18.71/share resistance level into play. A sustained move above the 23.60% Fibonacci retracement level would confirm the bullish momentum and could boost the bulls’ run towards the next target at the $19.41/share resistance level.
However, should the bears continue to push the price lower, investors could be looking to the current psychological level at $17.50/share as a potential buy-the-dip level.
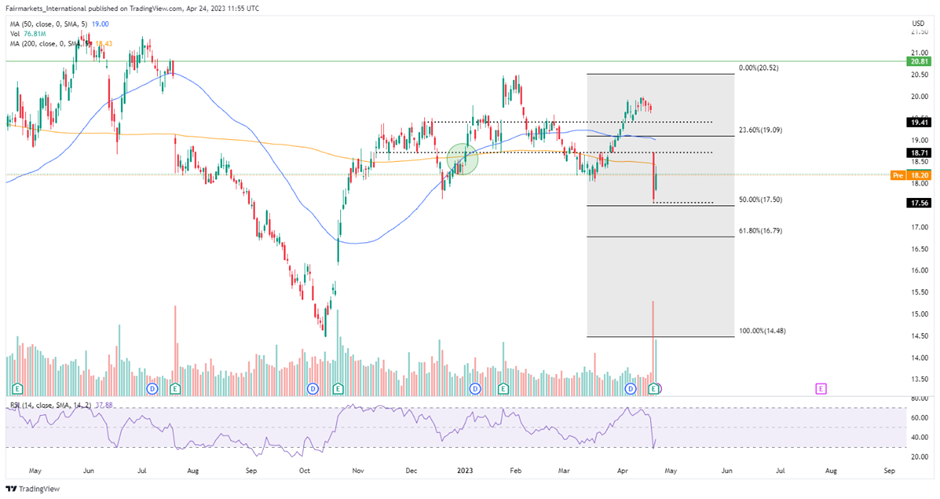
Using the discounted cash flow model, AT&T’s fair value is $20.81/share, which offers an upside of 14.34% from the share’s current pre-market price of $18.20/share.
Fundamentals
The company’s share tanked more than 10% following the release of the quarterly earnings report for 2023Q1, which showed a weakened free cash flow value of $1 billion for the quarter. The main reason for the decline is that one of the key selling points for the US diversified telecommunications services share is their dividend-paying ability, with the share having a healthy average dividend yield of 6.08%. The contraction of the cash flow spooked investors as the market speculated on the company’s ability to pay its dividend on its’ share, which has lost more than 38% in the last 3-and-a-half years.
The reported quarterly earnings per share (EPS) of $0.60/share versus the expected $0.585/share marked a twelfth consecutive bottom-line Wall Street estimate beat, but it was lower than the $0.61/share reported for 2022Q4. Investors could also find value in the share after the company’s mobility revenue and the service revenue for the quarter grew by 2.5% and 5.2% year-on-year, respectively. The growth in the segment’s revenues was primarily driven by subscriber growth and higher ARPU, with the company adding 424,000 wireless subscribers and over 272,000 new AT&T Fibre customers.
The company has been firmly focused on increasing its wireless and home internet services following the selloff of its DirectTV in 2021. AT&T’s CEO John Stankey reiterated that their past results demonstrate the company’s customer-centric strategy adopted over three years ago and believe that the strategy could help diversify the company’s subscriber demographics and provide sustainable long-term growth.
EBITDA rose to $10.6 billion in 2023Q1 from $10.2 billion in 2022Q4. However, declining profitability could deter some investors from going long on the share with recent figures. The 12.48% year-on-year decline of the operating cash flow to $6.678 billion for 2023Q1 from the $7.630 billion achieved in 2022Q1, leading to a slump of 12.18% in net profit to $4.18 billion for 2023Q1 versus the $4.76 billion achieved in 2022Q1.
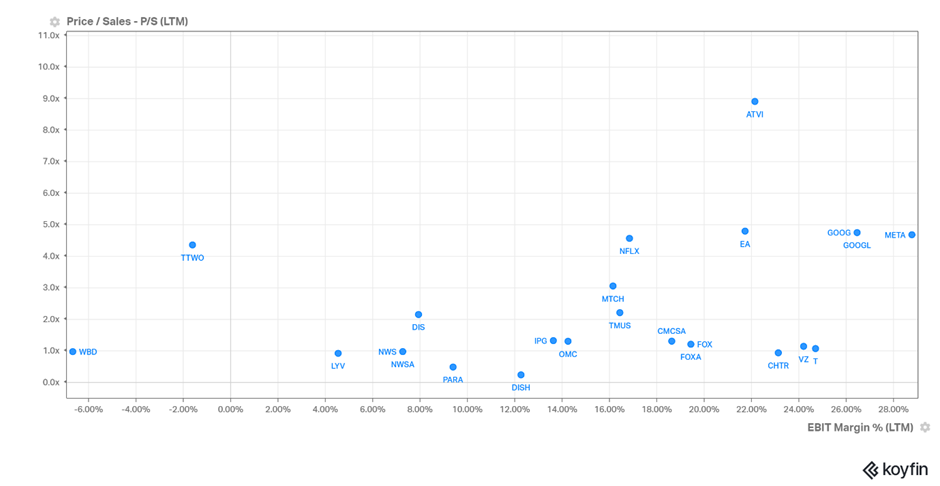
The picture below shows that the in the telecommunication industry, within the S&P500 Index, the Alphabet and Meta stocks beat AT&T’s EBIT Margin of 24.20%. However, AT&T’s lower price/sale (P/S) ratio could suggest the share is currently undervalued compared to its peers and might entice investors who are looking for a telecommunication company with a good bottom line at a discount.
The picture below shows that the company’s share has returned a total return of 8.65% in the last twelve months, which is higher than an of the company’s direct peers and has also outperformed the S&P500 Index’s total return of -8.76% for the same period. The picture shows that the company’s share has been performing quite well when combined with its 6.08% dividend yield in the past year as it continues its recovery to pre-Covid figures.

However, the company maintained the full-year guidance of an EPS of $2.35/share to $2.45/share from the free cash flow of approximately $16 billion. The company’s executives still maintain the free cash flow estimate for the year after they said the decline for the quarter was consistent with their expectations due to the timing of the company’s capital investments and device payments.
Summary
Company fundamentals suggest that the company’s share is a potential prospect with enticing upside potential, even more so following the overreaction to the recent quarterly report from the company. However, even though the future outlook is decent, the company could look to improve on some aspects of the business to improve its margins. Nevertheless, a long opportunity could exist at $18.71/share should the bulls continue to push the share higher, with a buy-the-dip opportunity at $17.50/share.
Sources: TradingView, KoyFin, CNBC, Seeking Alpha, MarketWatch.
DISCLAIMER:This report has been prepared by our Group company. This document is not intended as an offer, solicitation or recommendation to buy or sell financial instruments or to make any investment. The Group has used reasonable efforts to obtain information from reliable sources and the report is provided without representation or warranty of any kind (neither expressed nor implied). The Group disclaims liability for any publication not being complete, accurate, suitable and relevant for the recipient. Specifically, the Group disclaims liability towards any user and other recipients of this report.
